
Case study · Mercedes-AMG C 63 S
597 HP looked finished. The Datalog said otherwise.
Three road logs, one morning. How AT Cloud caught knock that the power curve couldn't show, and proved the fix: +67 HP, +106 Nm and a health score back to 97/100.
+67 HP / +106 Nm
Stock to Stage 1, predicted from road logs
40 → 97/100
Health score, first map to final map
−0.83 s
100 → 200 km/h, stock to Stage 1

A 2018 Mercedes-AMG C 63 S (W205), 4.0 V8 biturbo, Bosch MED17.7.5 ECU, rated 510 hp from the factory. The goal: a Stage 1 that holds from one pull to the next. Three full-load logs were recorded on 14 October 2026: stock, first map, and final map.

Step 1 · Stock
A clean reference: 100/100
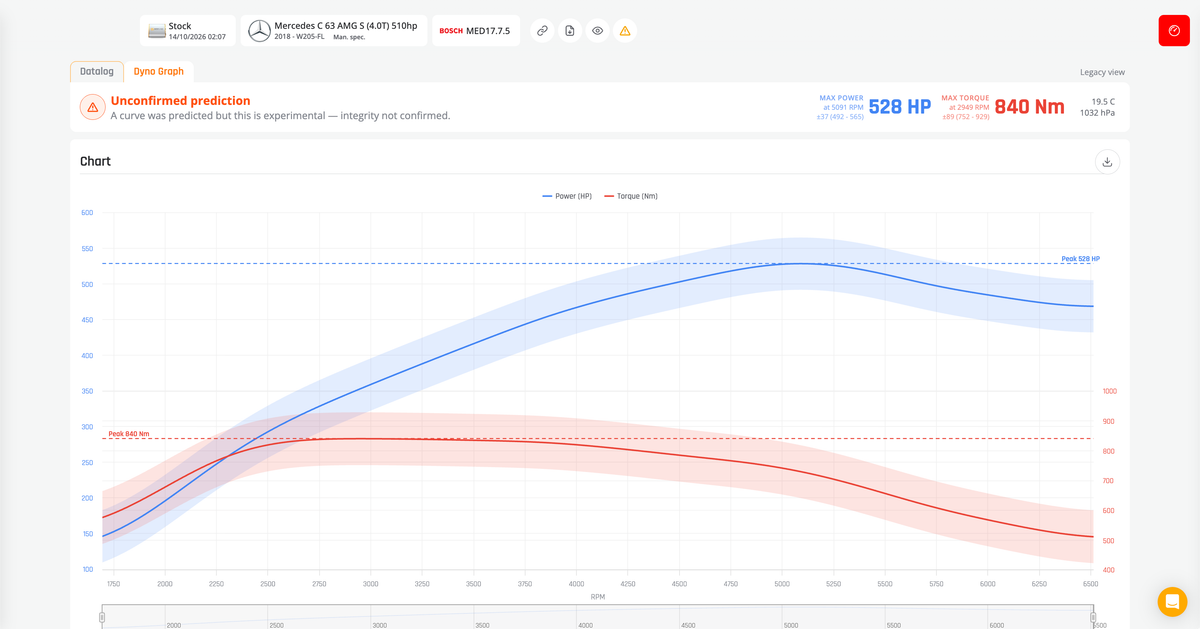
Before changing anything, a full-load pull on the stock car. The Datalog report finds nothing to fix and the Dyno Graph predicts 528 HP and 840 Nm. Every later log is compared with this one.

Step 2 · First map
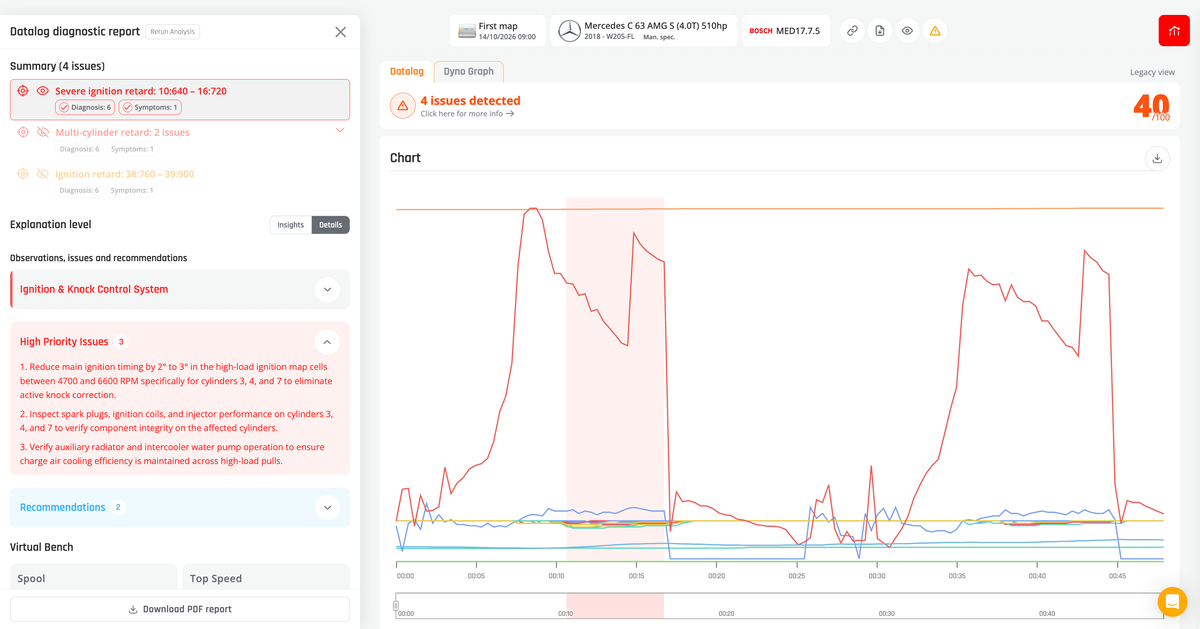
597 HP, but the engine is knocking: 40/100
The first map adds about 70 HP, and on a power curve alone it looks finished. The Datalog report shows the ECU pulling up to 4.5° of timing on cylinders 3, 4 and 7 at high load, on two pulls in a row.

Step 3 · Stage 1
Thirteen minutes later: 97/100
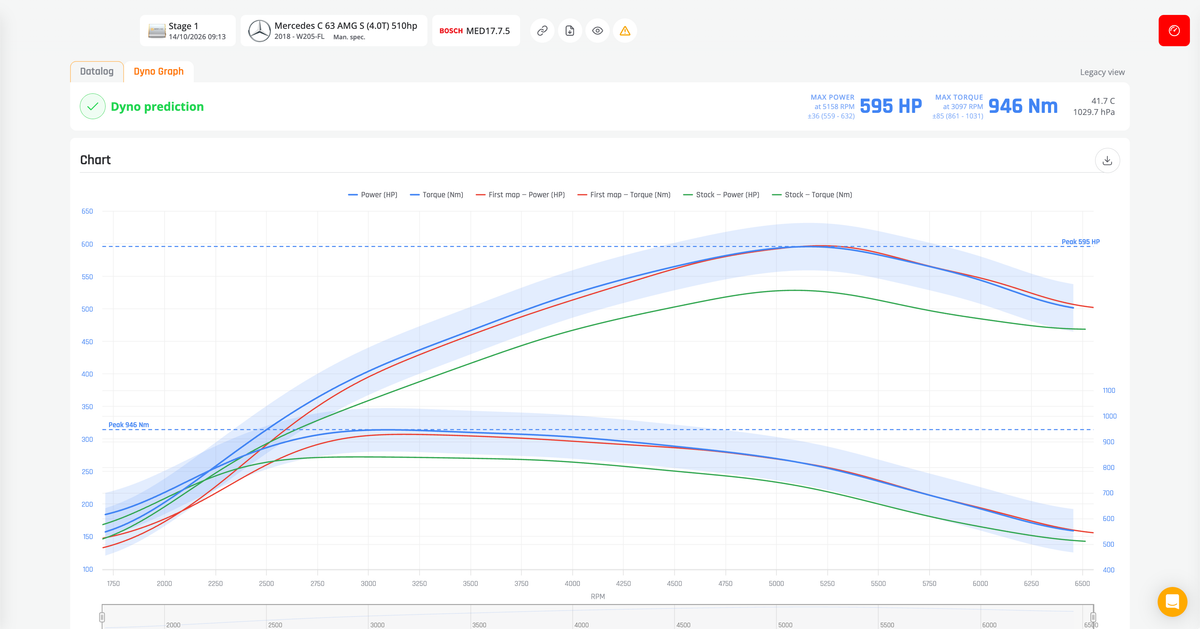
Timing is reduced by 2° to 3° where the engine knocked, and the car is logged again. Same peak power at 595 HP, more torque at 946 Nm, and no more knock. One minor note remains on cylinder 7, within normal spread.
AT Cloud report
The report doesn't stop at “knock”. It rules out the fuel, since three cylinders stay clean, and a single faulty cylinder, since three are affected at once. It points to charge cooling and air distribution between the banks, and gives the change to make.
Target
Select an issue: it is outlined, the others fade, and the chart keeps only the channels involved.
System card
Ignition & Knock Control System: what was seen, what it means, what was ruled out and the checks to run.
High Priority Issues
The fixes, with the figures to apply: timing, rpm range and cylinders."
Issue zone
The time window of the issue in the log, here two pulls in a row.
Reduce main ignition timing by 2° to 3° in the high-load ignition map cells between 4700 and 6600 RPM specifically for cylinders 3, 4, and 7 to eliminate active knock correction.
Datalog report, High Priority Issues
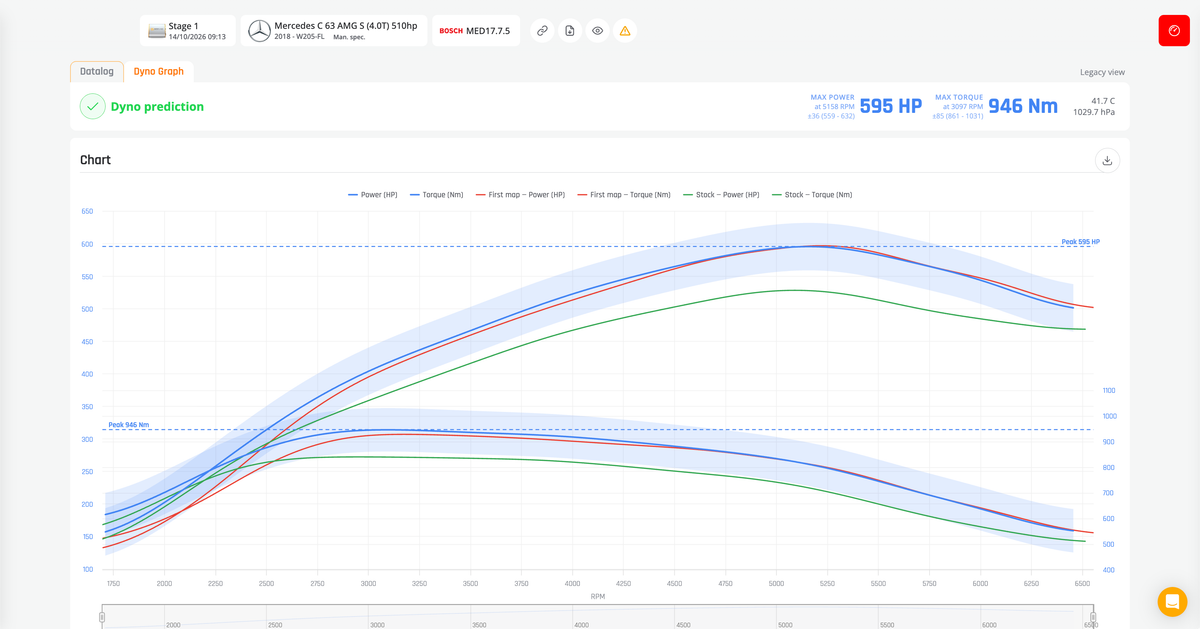
Each log gets its own predicted dyno curve. Add the earlier logs of the same car as runs: AT Cloud draws them on one chart, each in its own colour, with power and torque at every rpm step in one table. The stock curve sits well below; the first map and Stage 1 meet at the top.
100/100
40/100
97/100
528 HP at 5091 rpm
597 HP at 5218 rpm
595 HP at 5158 rpm
840 Nm at 2949 rpm
928 Nm at 3176 rpm
946 Nm at 3097 rpm
4.74 s
3.80 s
3.91 s
+68 HP, +88 Nm
+67 HP, +106 Nm
Predicted crank figures from road logs, each with a likely range of about ±37 HP.
Stock
Stage 1
Stock/Stage 1

Acceleration, measured from the same logs
The Virtual bench reads the vehicle speed recorded in the log. No extra hardware, no extra run: the pull that feeds the report and the dyno also gives spool time, top speed, and the time and distance between any two speeds. Drag the handles to pick the window.
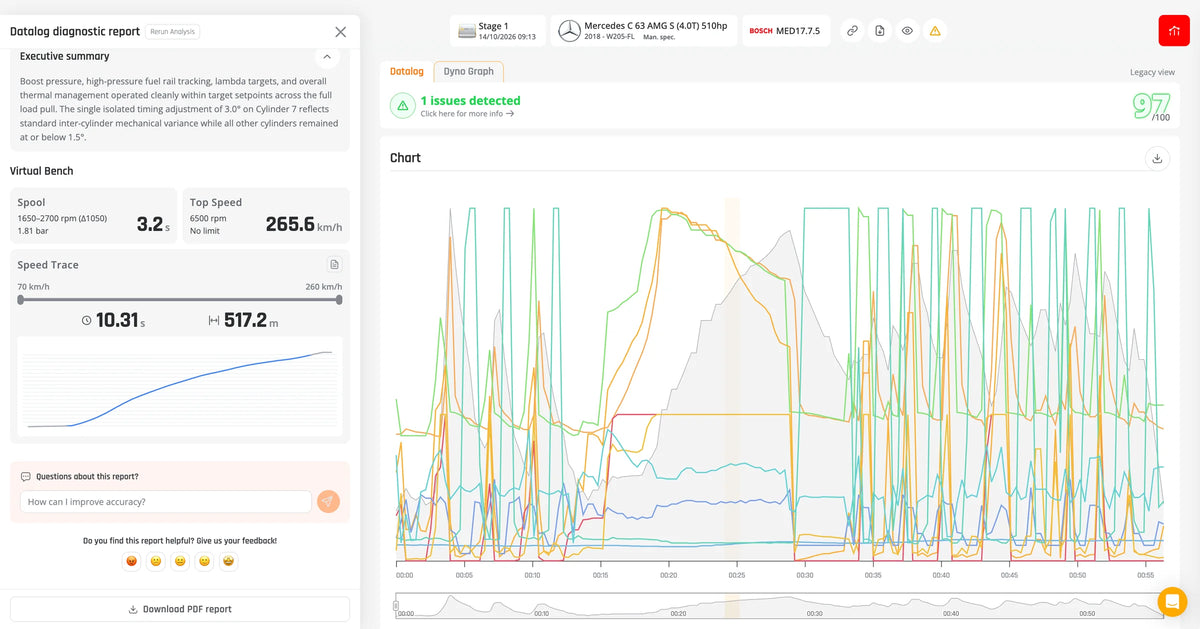
One click exports a PDF report. Choose what goes in: the diagnostic, the metrics, or both. On this Stage 1 log, the full export is three pages: the report, the dyno curve and the Virtual bench, with the vehicle and the date on each.
Predicted crank power
Every figure is predicted crank power from a road log, with a likely range. A rolling road that measures at the wheels reads lower.
Not weather-corrected
The stock log was recorded at 19.5 °C, Stage 1 at 41.7 °C. Compare logs of the same car, on the same road, in similar conditions.
Frequently Asked Questions
The score follows the worst issue, not the power. Active knock correction on three cylinders is a high-priority issue, so the log lands in the critical band whatever the dyno says.
Timing was reduced where the engine was knocking. Peak power stays at about 595 HP, torque rises to 946 Nm, and the engine no longer pulls timing, so the result holds from one pull to the next.
No. It predicts crank power from the road log, with a likely range. A rolling road that measures at the wheels reads lower.
Below 200 km/h, Stage 1 is 0.83 s quicker from 100 to 200. Above it, the stock run was quicker on the day, in much cooler air. Road runs are not corrected for weather, wind or slope.
No. It tells you what is wrong, why and what to change, with figures and a check for the next log. You make the change.
Record a full-load pull, upload it, and get the Datalog report, the Dyno Graph and the Virtual bench from the same log.

The Tool
Three logs, 13 minutes, one fixed map. None of it happens without the read and write that come first. The AutoTuner Tool handles both on ECUs and TCUs, through OBD, Bench or Boot, from one box on your bench. Same hardware, from the first read to the last log.